Expensive Ride Analysis
How do you measure the financial impact of a client on the Access bus system? One can imagine a ‘cost-per-boarding’ type of metric might be useful for assessing total client costs. Currently, King County Metro uses an intuitive but not very granular definition of cost-per-boarding: total Access expenditures divided by number of clients serviced in a year.
Instead, we came up with a new definition of cost-per-boarding:
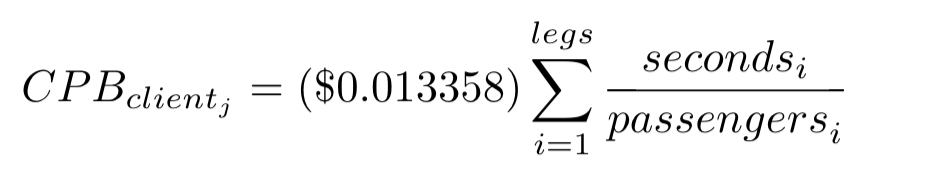
That is, the cost-per-boarding of client j is the sum over all of the ‘legs’ during which the client is on board the bus of the total seconds the leg takes divided by the number of passengers during the leg. For example, suppose client 123 is on the bus for 2 legs (that is, ze gets on the bus, the bus stops to service another client, and then drops client 123 deboards), the first leg takes 900 seconds and there are 4 total passengers, and the second leg takes 400 seconds and there are 3 passengers. This cost per boarding is $4.86$. Note that the average Access service cost per second is $48.09/3600, i.e. $0.013558 per second.
From the 4-month ridership data (Jan 1, 2015 - April 30, 2015) we received from King County Metro, we can see the distribution of cost per boardings:
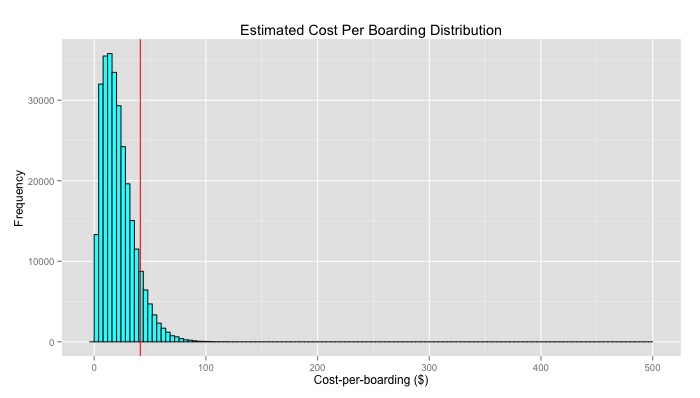
From here, we’ve chosen to call the top 10% of these costs the ‘ugly rides’ (this is a term used by KCM… we didn’t coin it!). These ‘ugly rides’ account for 24.4% of all client boarding costs. Now KCM has a working definition for ugly ride.
There are still a few things that effect overall operational costs for a given bus, mainly, deadheading time. If two buses only have one client for an equal amount of time, but one bus has to travel to Snoqualmie and the other’s client is in Bellevue, the former bus will be more expensive. We have done additional analysis on the amount of deadheading time Access buses usually spend - the average bus spends about 30% of its time without passengers on board!