Out-of-Service Buses
During our historical analysis for King County Metro (KCM), we looked into the possibility of predicting out-of-service buses each day. Buses become out-of-service generally after breaking down or if they are unable to arrive at their destinations. Predicting out-of-service buses is important from an operational perspective because KCM and their contractors can better manage their vehicle fleet by preparing adequate standby vehicles each day.
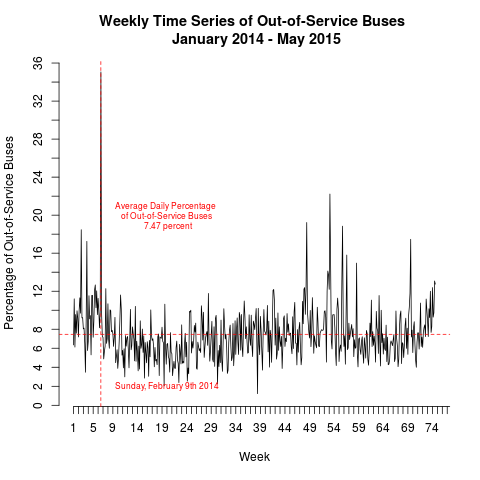
Our model uses the daily percentage of out-of-service buses relative to all buses operating that day (instead of raw counts of out-of-service buses). Using time series techniques, we analyzed almost 18 months (January 2014 to May 2015) of KCM transit data and concluded:
- On average, 7.47% of buses are out-of-service each day
- No deterministic trend over time
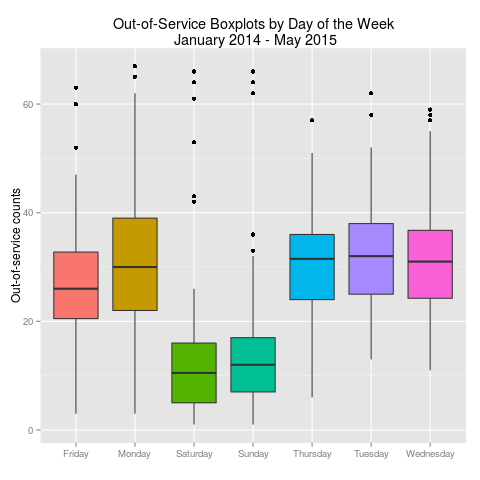
- Some weekly seasonal variation (more on that later)
- A snowstorm on February 9th 2014 coincided with the highest daily percentage of out-of service buses

For those with more knowledge of time series, additional analyses revealed:
- Out-of-service bus percentages are likely stationary
- Cross validation comparisons between ARMA models indicate an AR(1)MA(2) may be the best model to forecast future daily percentages of out-of-service buses

Back to the weekly seasonal variation. Although t-test between the daily means of out-of-service events did not reveal statistical differences across weekdays, we did notice the average Friday count seems below the average Monday count. The weekly seasonal difference between Friday and Monday is also shown in our time series analysis so we created hypotheses for weekly trends in out-of-service bus reporting. One guess (your guess is as good better than ours) is that out-of-service counts could be lower on Friday (relative to Monday) because drivers are headed home for the weekend and report buses as out-of-service when they return on Monday.
